Beyond On-Time Delivery: The Vendor Metrics That Actually Predict Supplier Problems
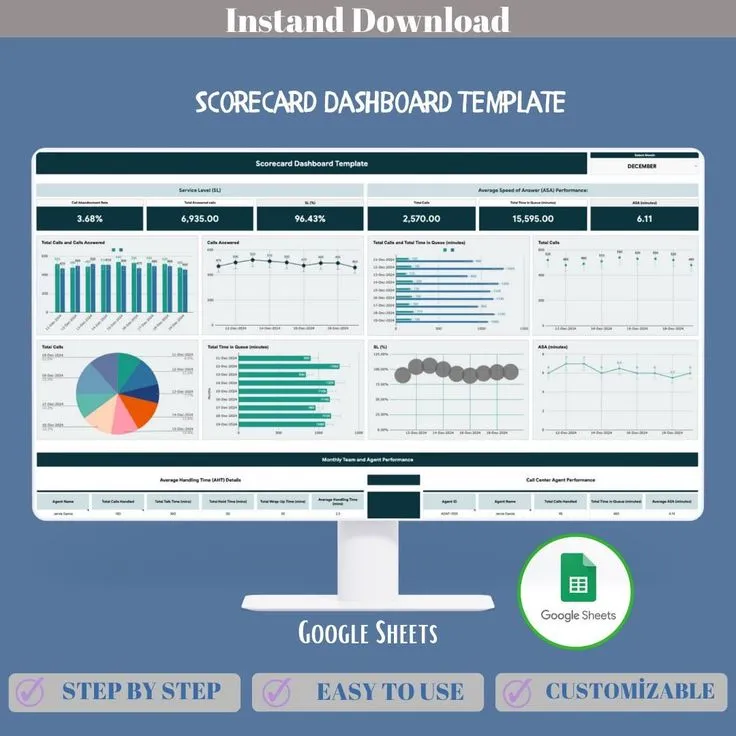
Photo: business performance scorecard metrics dashboard office, via i.pinimg.com
For decades, the standard toolkit for evaluating a supplier has looked roughly the same: on-time delivery rate, defect percentage, fill rate, and maybe invoice accuracy. These figures are easy to pull, easy to benchmark, and easy to present in a quarterly review. They are also, in many cases, dangerously incomplete.
The retailers who discover this lesson the hard way tend to share a common experience. Everything looks fine on paper — a supplier is hitting 97 percent on-time delivery and maintaining a defect rate well under threshold — right up until a critical peak-season order arrives two weeks late, or a product line quietly becomes unavailable because the supplier quietly stopped stocking it. By the time conventional metrics flag the problem, the damage is already done.
Building a supplier evaluation framework that genuinely protects your business means asking harder questions and measuring things that don't always appear on a standard vendor report.
Why Traditional KPIs Create a False Sense of Security
Conventional performance metrics are lagging indicators. They tell you what already happened, not what is about to happen. A supplier can maintain a strong on-time delivery average by consistently shipping small, easy orders on schedule while quietly struggling with larger or more complex fulfillment requests. Defect rates can look acceptable in aggregate while masking recurring quality issues concentrated in a specific product category or production run.
Fill rate, another commonly cited metric, is particularly prone to distortion. A supplier who routinely ships partial orders and marks them complete — counting on you to reorder the balance — can maintain a technically acceptable fill rate while consistently leaving gaps in your inventory. Unless you are tracking order completion against original purchase quantities rather than shipment confirmations, this pattern is nearly invisible.
The underlying problem is that most traditional KPIs measure outputs rather than capabilities. They document what a supplier delivered, but reveal little about whether that supplier has the operational depth, financial stability, and communication infrastructure to remain a reliable partner as your business scales or market conditions shift.
The Hidden Indicators That Actually Matter
Responsiveness to Urgent and Non-Standard Requests
How a supplier handles exceptions tells you far more about their operational character than routine orders. When you need to accelerate a shipment, modify an order mid-cycle, or source a substitute SKU on short notice, does your supplier engage quickly and constructively — or do requests disappear into a queue? Tracking response time and resolution rate for non-standard requests is one of the most reliable predictors of how a supplier will perform under pressure.
Payment Terms Flexibility and Financial Signaling
A supplier who suddenly becomes inflexible about payment terms, pushes for prepayment on orders that previously carried net terms, or begins requesting early payment discounts more aggressively than usual may be signaling cash flow strain. These behavioral shifts often precede more serious operational disruptions by weeks or months. Including payment terms behavior as a tracked variable in your scorecard gives you an early warning system that balance-sheet reviews alone will not provide.
Data Integration and Reporting Capability
In an environment where inventory visibility and demand forecasting are increasingly critical, a supplier's ability to share structured, timely data is a genuine operational asset. Can your supplier provide advance shipping notifications in a format your systems can ingest automatically? Do they maintain accessible inventory availability feeds? Are their catalogs and pricing updates delivered in a structured way, or does your team spend hours manually reconciling spreadsheets?
Suppliers who lack modern data sharing capabilities create invisible friction costs — labor time, reconciliation errors, and delayed decision-making — that never appear on a standard KPI dashboard but accumulate steadily over the life of the relationship.
Lead Time Consistency vs. Lead Time Average
Average lead time is a metric most retailers already track. Lead time variance is one far fewer monitor with the same discipline. A supplier with an average lead time of 12 days but a range that swings between 7 and 21 days creates planning problems that a supplier averaging 14 days with consistent, predictable timing does not. Variance, not average, is what disrupts your replenishment cycles and forces costly safety stock decisions.
Category-Level Performance Disaggregation
Aggregate performance numbers can obscure significant variation at the product category or SKU level. A supplier may perform excellently on commodity items while struggling with specialized or custom products. If your business relies on that supplier for both, the aggregate score will overstate your actual risk exposure. Scoring supplier performance at the category level — and weighting those scores according to each category's revenue contribution — gives you a far more accurate picture of where you are genuinely protected and where you are not.
Building a Modern Supplier Scorecard
A practical scorecard framework for today's retail environment should incorporate at least five distinct performance dimensions:
- Fulfillment Reliability — On-time delivery rate, fill rate accuracy, and lead time variance (not just average).
- Product Quality — Defect rates by SKU and category, return rates attributable to supplier quality, and resolution time for quality disputes.
- Operational Responsiveness — Response time to urgent requests, exception handling rate, and proactive communication frequency regarding potential delays or shortages.
- Commercial Flexibility — Payment terms behavior, willingness to accommodate order volume fluctuations, and pricing transparency.
- Data and Systems Compatibility — Availability of structured data feeds, EDI or API integration capability, and accuracy of catalog and inventory information.
Each dimension should carry a weighted score that reflects its relative importance to your specific business model. A retailer with a highly seasonal sales profile, for example, should weight operational responsiveness and lead time consistency more heavily than a business with stable, year-round demand patterns.
Scores should be reviewed at a defined cadence — quarterly at minimum, monthly for high-volume or strategically critical suppliers — and tied to a clear escalation protocol. A supplier whose score drops below a defined threshold should trigger a formal review conversation, not simply a note in a file.
Turning Scorecard Data Into Commercial Leverage
A well-constructed scorecard is not just a risk management tool — it is a negotiating asset. When you arrive at a supplier review with documented performance data across multiple dimensions, you shift the conversation from subjective impressions to objective evidence. Suppliers who are performing well gain recognition and, potentially, preferred partner status. Those who are underperforming are confronted with specific, measurable gaps rather than vague dissatisfaction.
For merchants operating through B2B commerce platforms and supplier networks, scorecard data also informs sourcing decisions. When multiple suppliers serve overlapping categories, performance scores provide a rational basis for allocating volume — rewarding operational excellence rather than simply defaulting to established relationships.
The suppliers who will drive the most long-term value for your business are not necessarily those with the best headline numbers. They are the ones whose full operational profile — responsiveness, flexibility, data capability, and consistency — aligns with how your business actually needs to function. Building the tools to see that clearly is not optional. It is the foundation of sound supplier management.